|
|
University-数学讨论区-Probability and Statistic I, II
[复制链接]
|
|
|
 发表于 18-5-2009 12:55 PM
|
显示全部楼层
发表于 18-5-2009 12:55 PM
|
显示全部楼层
原帖由 乙劍真人 于 18-5-2009 11:50 AM 发表 
应该错吧..
Z score > +- 2 = outlier
extreme value 比 outlier 远..
其实这题问得很模糊 。。。很subjective 。。。不是一个好问题。 outlier是outlier, extreme是extreme,不同定义 。。。如果单是比远, outlier 远点。 |
|
|
|
|
|
|
|
|
|
|
|
发表于 18-5-2009 02:09 PM
|
显示全部楼层
回复 118# yusin 的帖子
As a general rule, an observation is considered an extreme value if its Z score is less than - 3
请问是对还是错呀?
:: 对,因为 -3 或更极端的值 ( 小过-3, 如 -4, -5 ... ) 的概率非常小。
The probability that a standard normal random variable, Z, is between 1.50 and 2.10 is the same as the probability Z is between -2.10 and -1.50.
:: 对, 因为正态分布是对称的 (symmetric)。
For sample size 16, the sampling distribution of the mean will be approximately normally distributed ____.
:: b. Central Limit Theorem 的适用性必需考虑比较大的样本。对于小样本,如果能假设对称性,那么其均值的样本分布 (SAMPLING DISTRIBUTION OF MEAN) 和正态逼近很接近。 |
|
|
|
|
|
|
|
|
|
|
|
发表于 18-5-2009 02:32 PM
|
显示全部楼层
原帖由 斷羽鳥 于 18-5-2009 12:55 PM 发表 
其实这题问得很模糊 。。。很subjective 。。。不是一个好问题。 outlier是outlier, extreme是extreme,不同定义 。。。如果单是比远, outlier 远点。
鸟兄我都弄乱了..
以前我是这样做笔记的哦..请指教..
 |
|
|
|
|
|
|
|
|
|
|
|
发表于 18-5-2009 03:07 PM
|
显示全部楼层
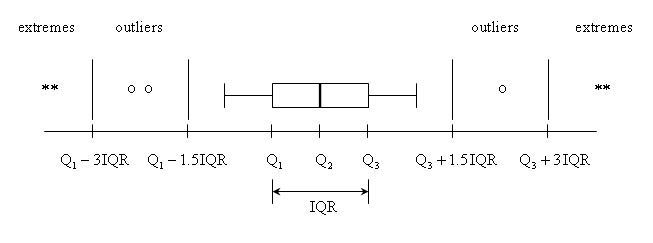
这个可能是boxplot的definitions来。详情如何我不太懂。
据我的了解, extremes指的是在distribution两端的值。通常取决于一个你自己预设的percentile值。这个我们叫极值。outlier指的是“异常值”,一个本不应该属于population里面的值。可能是因为仪器故障,还是认为错误造成的数据。
e.g 人的身高。
200cm 是极值。 2000cm 就肯定是一个异常值了。
不过这个是我的了解啦。不同的方面可能有不同的解释。
原帖由 乙劍真人 于 18-5-2009 02:32 PM 发表
鸟兄我都弄乱了..
以前我是这样做笔记的哦..请指教..
|
|
|
|
|
|
|
|
|
|
|
|
发表于 20-5-2009 03:12 PM
|
显示全部楼层
回复 124# 斷羽鳥 的帖子
谢谢鸟兄的解答..
我想我明白当中的差别了.. |
|
|
|
|
|
|
|
|
|
|
|
发表于 22-5-2009 12:04 PM
|
显示全部楼层
有一題關于chi-square的我不會做....
If 10 observations are taken independently from a chi-square distribution with 19 degrees of freedom, find the probability that exactly 2 of the 10 sample items exceed 30.14. |
|
|
|
|
|
|
|
|
|
|
|
发表于 22-5-2009 12:10 PM
|
显示全部楼层
這一題我不明白它要什么???!!!
The weekly repair cost X for a machine has a pdf given by
f(x) = { 3(1-x)^2 , 0<x<1
0 , elsewhere
with measurement in hundreds of RM. How much money should be budgeted each week for repair costs so that the actual cost will exceed the budgeted amount only 10% of the time? |
|
|
|
|
|
|
|
|
|
|
|
发表于 22-5-2009 12:21 PM
|
显示全部楼层
Given m(t) = (1-2t) ^ -12
我找到E(x) = 24, Var(x) =48, 而且m(t) 是gamma distribution.
問題是 P(15.66<x<42.98) 要怎樣找?
我老師叫我用Chebyshev's Theorem,可是我還是不會!! |
|
|
|
|
|
|
|
|
|
|
|
发表于 26-5-2009 04:52 PM
|
显示全部楼层
原帖由 ~龍兒~ 于 22-5-2009 12:04 PM 发表 
有一題關于chi-square的我不會做....
If 10 observations are taken independently from a chi-square distribution with 19 degrees of freedom, find the probability that exactly 2 of the 10 sample items e ...
先求 q = P(X > 30.14), X ~ chisq (19)
接着用 Binomial distribution 解就可以了,因为你只需要考虑两种结局 (X > 30.14), (X < 30.14).
N ~ Bin (10, q) ; P(N = 2) |
|
|
|
|
|
|
|
|
|
|
|
发表于 26-5-2009 05:49 PM
|
显示全部楼层
原帖由 ~龍兒~ 于 22-5-2009 12:10 PM 发表 
這一題我不明白它要什么???!!!
The weekly repair cost X for a machine has a pdf given by
f(x) = { 3(1-x)^2 , 0
你确定问题对吗?那个 pdf 的积分不是 1 哦. |
|
|
|
|
|
|
|
|
|
|
|
发表于 26-5-2009 06:00 PM
|
显示全部楼层
原帖由 ~龍兒~ 于 22-5-2009 12:21 PM 发表
Given m(t) = (1-2t) ^ -12
我找到E(x) = 24, Var(x) =48, 而且m(t) 是gamma distribution.
問題是 P(15.66
老师一定要你用 CHEBESHEV INEQUALITY 吗?这个不等式一般用来证理论题,实用性不强。你可以试用NORMAL APPROXIMATION, 当 alpha parameter (红) 越大,逼近值越好。
小弟做了一个比较:
Gamma (alpha =12, beta = 2) : P(15.66 < X < 42.98) = 0.889956 [用特定软件算的]
Normal approximation ( m = 24, var = 48 ) : P(15.66 < X < 42.98) = 0.8825854
相当合理的逼近。 |
|
|
|
|
|
|
|
|
|
|
|

楼主 |
发表于 26-5-2009 10:37 PM
|
显示全部楼层
回复 131# 铁蛋 的帖子
请问你用的特定软件是哪种?
我是用R
你有听过或用过吗? |
|
|
|
|
|
|
|
|
|
|
|
楼主 |
发表于 26-5-2009 10:43 PM
|
显示全部楼层
回复 131# 铁蛋 的帖子
请问你用的特定软件是哪种?
我是用R
你有听过或用过吗? |
|
|
|
|
|
|
|
|
|
|
|
发表于 27-5-2009 10:24 AM
|
显示全部楼层
回复 133# ~HeBe~_@ 的帖子
就是 R,免费而且很 cool 的 graphics 功能。 |
|
|
|
|
|
|
|
|
|
|
|
楼主 |
发表于 27-5-2009 12:00 PM
|
显示全部楼层
回复 134# 铁蛋 的帖子
哈哈。。。我还没学到graphic哦。。
我只知道用R来找probability..
请问可以用R来画graph吗?
^^ |
|
|
|
|
|
|
|
|
|
|
|
发表于 27-5-2009 01:59 PM
|
显示全部楼层
回复 135# ~HeBe~_@ 的帖子
那是R的强项 (可以任意 customize)。
要画分布图也是很容易,比如
x <- seq(-3,3,0.01)
plot(x, dnorm(x, 0, 1), type="l", xlab="x", ylab="Density" )
试试看
[ 本帖最后由 铁蛋 于 27-5-2009 02:00 PM 编辑 ] |
|
|
|
|
|
|
|
|
|
|
|
发表于 27-5-2009 02:57 PM
|
显示全部楼层
|
|
|
|
|
|
|
|
|
|
|
楼主 |
发表于 27-5-2009 10:37 PM
|
显示全部楼层
回复 136# 铁蛋 的帖子
好的,我试试看。。看来又学到新的东西咯。。^^
谢谢你。。嘻嘻。。 |
|
|
|
|
|
|
|
|
|
|
|
发表于 29-5-2009 02:54 PM
|
显示全部楼层
|
R,如果是serious的statisticians 应该要学起来 。。。flexibility很高,很powerful。Alpha就还在起步的阶段,以后不懂会怎样,不过至少现在我还是不会用它咯。 |
|
|
|
|
|
|
|
|
|
|
|
发表于 3-6-2009 06:32 PM
|
显示全部楼层
|
|
|
|
|
|
|
|
|
| |
 本周最热论坛帖子 本周最热论坛帖子
|


 897
897  93
93