|
|
 发表于 14-2-2009 09:01 AM
|
显示全部楼层
[quote]原帖由 啊土 于 14-2-2009 03:36 AM 发表 

请问。。。我这样做对吗?
1:画出支撑线(131.89)和阻力线(132.67)。
LATEST closed candle =2号
Current moving candle =3号
支撑线&阻力线是画2号的candle.
我的技术应用在Daily,4 hour,1 hour图会发挥最大的效用。也可以应用在15分钟图,除非市场波幅大才可以用在15分钟图.
|
|
|
|
|
|
|
|
|
|
|
|
 发表于 14-2-2009 11:59 AM
|
显示全部楼层
|
希望 LZ 能把每一位大大分享了的心得放在第一楼, 然后在注明是谁分享的。那新成员或要问题就方便的多了。希望这个站能!发光发热! |
|
|
|
|
|
|
|
|
|
|
|
 发表于 14-2-2009 12:13 PM
|
显示全部楼层
|
虽然外汇站比不上我们的股票站那么热闹,但我觉得这是我们还更着别人后面或还不懂得外汇知识。 |
|
|
|
|
|
|
|
|
|
|
|
 发表于 14-2-2009 02:39 PM
|
显示全部楼层
抱歉改正。。。。请指教

这是1h的图,昨晚接近收市的交易。
1。这是蜡烛结束后开始画线的地方:支撑线(131.89)和阻力线(132.67)。
2。这是开始下单的地方。买131.69,卖132.46。
在最后的10分钟动到了买单132.46
3。接下来的走势。
我的问题:
1.经过反复的检查。我的买单应该挂132.06才对,是吗?(131.89+20pips)
2.在第2支蜡烛的最低价是131.94。如果当初是挂132.06,那么到了131.94时就会出现12pips的赢利,但如何判断该结束走人?
3.因为可能开始出现赢利了但还到标就一去不回头了,怎么办?通常赢利目标时多少?是20差点吗?
4.如果是先动到买单132.46,然后接下来的走势都是低于132.46,怎么办?
5.在接近结束时间的时候才动到所挂的单,需要做什么样的准备?还是再等下一轮的蜡烛吗?
谢谢~!!! |
|
|
|
|
|
|
|
|
|
|
|
 发表于 14-2-2009 03:11 PM
|
显示全部楼层
原帖由 啊土 于 14-2-2009 02:39 PM 发表 

这是1h的图,昨晚接近收市的交易。
1。这是蜡烛结束后开始画线的地方:支撑线(131.89)和阻力线(132.67)。
2。这是开始下单的地方。买131.69,卖132.46。
在最后的10分钟动到了买单132.46
3。接下来的走势。
我的问题:
1.经过反复的检查。我的买单应该挂132.06才对,是吗?(131.89+20pips)
买单=132.46,卖=131.69.ONLY place buy/stop order at candle 1. other candle is for u to run if wrong direction.
2.在第2支蜡烛的最低价是131.94。如果当初是挂132.06,那么到了131.94时就会出现12pips的赢利,但如何判断该结束走人?
once green pips,马上set 1 pips stop loss.如何判断该结束走人?depends on your target.some 10 pips already ok.some 100 pips not enough.u need to know how to read trend to know the next movement.
3.因为可能开始出现赢利了但还到标就一去不回头了,怎么办?通常赢利目标时多少?是20差点吗?
赢利目标depends on your target
4.如果是先动到买单132.46,然后接下来的走势都是低于132.46,怎么办?
cut loss...... try to place your order more than 20 pips for hour candle.
5.在接近结束时间的时候才动到所挂的单,需要做什么样的准备?还是再等下一轮的蜡烛吗?
close all order b4 market close. |
|
|
|
|
|
|
|
|
|
|
|
 发表于 14-2-2009 09:45 PM
|
显示全部楼层
|
|
|
|
|
|
|
|
|
|
|
 发表于 14-2-2009 10:05 PM
|
显示全部楼层
|
|
|
|
|
|
|
|
|
|
|
 发表于 14-2-2009 10:05 PM
|
显示全部楼层
|
|
|
|
|
|
|
|
|
|
|
 发表于 14-2-2009 11:40 PM
|
显示全部楼层
Hi polis001,
I value your sharing!
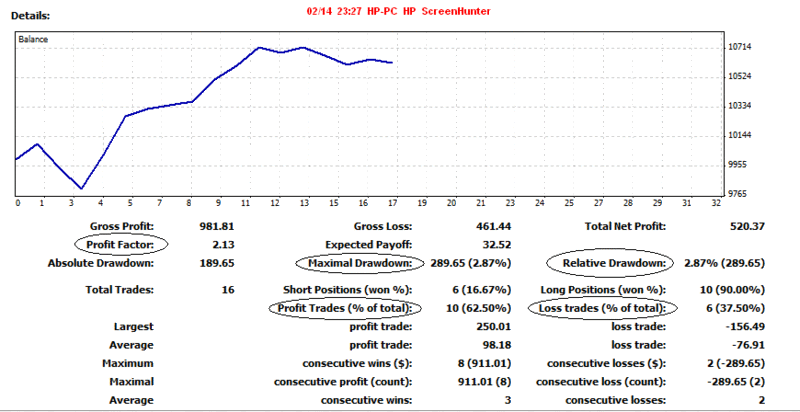
But, as real traders, we know showing profits/gains is only part of the story. To assess a system/method, we need more numbers such as Profit Factor, Maximal and Relative Drawdown, % Profit and Loss Trades, etc. Please see image below as example.

Appreciate if you could provide these numbers.
No offence; just my 2 cents!
[ 本帖最后由 chatklse 于 15-2-2009 12:15 AM 编辑 ] |
|
|
|
|
|
|
|
|
|
|
|
 发表于 15-2-2009 12:55 AM
|
显示全部楼层
|
|
|
|
|
|
|
|
|
|
|
 发表于 15-2-2009 11:18 AM
|
显示全部楼层
|
我想问什么是MP2009, 怎样setup那个图的? |
|
|
|
|
|
|
|
|
|
|
|
 发表于 15-2-2009 12:20 PM
|
显示全部楼层
|
|
|
|
|
|
|
|
|
|
|
 发表于 15-2-2009 02:27 PM
|
显示全部楼层
|
|
|
|
|
|
|
|
|
|
|
 发表于 15-2-2009 02:29 PM
|
显示全部楼层
原帖由 kin8198 于 15-2-2009 11:18 AM 发表 
我想问什么是MP2009, 怎样setup那个图的?
http://cforum1.cari.com.my/viewthread.php?tid=1249423&extra=page%3D1&page=1 |
|
|
|
|
|
|
|
|
|
|
|
 发表于 15-2-2009 02:31 PM
|
显示全部楼层
|
|
|
|
|
|
|
|
|
|
|
 发表于 15-2-2009 09:06 PM
|
显示全部楼层
Polis兄,請問星期日的daily candle阻力與支撐線是否可以亦可作星期一開市下單的參考?
通常星期日的波動都很小,還是說參考回星期五的日燭線?
謝謝. |
|
|
|
|
|
|
|
|
|
|
|
 发表于 15-2-2009 10:39 PM
|
显示全部楼层
原帖由 chatklse 于 14-2-2009 11:40 PM 发表
Hi polis001,
I value your sharing!
But, as real traders, we know showing profits/gains is only part of the story. To assess a system/method, we need more numbers such as Profit Factor, Maximal a ...
下次扣你分:@ |
|
|
|
|
|
|
|
|
|
|
|
 发表于 16-2-2009 03:17 AM
|
显示全部楼层
请教:明天的准备工作。。。

1。13/02/09 星期五的行情:最高 133.9,最低 129.24。
画出阻力线:133.9, 支撑线: 129.24
2。准备下单:
买 133.7 (133.9 - 20差点)
卖 129.44 (129.24 + 20差点)
请问我这样做对吗?
趋势线(trend line) 是不是这样画的? |
|
|
|
|
|
|
|
|
|
|
|
 发表于 16-2-2009 08:35 AM
|
显示全部楼层
原帖由 潛水艇 于 15-2-2009 09:06 PM 发表  Polis兄,請問星期日的daily candle阻力與支撐線是否可以亦可作星期一開市下單的參考?通常星期日的波動都很小,還是說參考回星期五的日燭線?謝謝. Polis兄,請問星期日的daily candle阻力與支撐線是否可以亦可作星期一開市下單的參考?通常星期日的波動都很小,還是說參考回星期五的日燭線?謝謝.
SRDC发挥最高效力在星期二到五。通常星期日的波動都很小。星期一就以SR4C/MP2009/SR1C来入场。 |
|
|
|
|
|
|
|
|
|
|
|
 发表于 16-2-2009 08:39 AM
|
显示全部楼层
原帖由 啊土 于 16-2-2009 03:17 AM 发表  http://i324.photobucket.com/albums/k329/iooh/fx/test.jpg1。13/02/09 星期五的行情:最高 133.9,最低 129.24。画出阻力线:133.9, 支撑线: 129.242。准备下单:买 133.7 (133.9 - 20差点)卖 ... http://i324.photobucket.com/albums/k329/iooh/fx/test.jpg1。13/02/09 星期五的行情:最高 133.9,最低 129.24。画出阻力线:133.9, 支撑线: 129.242。准备下单:买 133.7 (133.9 - 20差点)卖 ... 
[ 本帖最后由 polis001 于 16-2-2009 08:41 AM 编辑 ] |
|
|
|
|
|
|
|
|
|
| |
 本周最热论坛帖子 本周最热论坛帖子
|