|
|
 发表于 13-11-2008 06:53 PM
|
显示全部楼层
发表于 13-11-2008 06:53 PM
|
显示全部楼层
|
|
|
|
|
|
|
|
|
|
|
发表于 14-4-2009 01:02 AM
|
显示全部楼层
来采场骗分。。
ntpm打算长期持有吗? |
|
|
|
|
|
|
|
|
|
|
|

楼主 |
发表于 29-3-2009 08:37 PM
|
显示全部楼层
|
专区重开, 欢迎踩场 |
|
|
|
|
|
|
|
|
|
|
|
发表于 29-3-2009 08:49 PM
|
显示全部楼层
|
|
|
|
|
|
|
|
|
|
|
楼主 |
发表于 14-4-2009 12:06 AM
|
显示全部楼层
卖了所有股票等下跌回调(剩 NTPM 没卖)
2008 年 6 月入场至 2009 年 4 月
实际盈利 3.2% 左右  |
|
|
|
|
|
|
|
|
|
|
|
发表于 14-4-2009 01:56 AM
|
显示全部楼层
|
|
|
|
|
|
|
|
|
|
|
楼主 |
发表于 14-4-2009 02:21 AM
|
显示全部楼层
ntpm 股息后,我每天都在排 sell all @ 0.325 
如果排不到,就等下个股息再看看。
现在打算退场先,无股一身轻 |
|
|
|
|
|
|
|
|
|
|
|
发表于 14-4-2009 02:32 AM
|
显示全部楼层
|
|
|
|
|
|
|
|
|
|
|
楼主 |
发表于 14-4-2009 02:39 AM
|
显示全部楼层
等 700 - 800 点,希望会有  |
|
|
|
|
|
|
|
|
|
|
|
发表于 14-4-2009 09:27 AM
|
显示全部楼层
|
|
|
|
|
|
|
|
|
|
|
楼主 |
发表于 14-4-2009 09:41 AM
|
显示全部楼层
|
我卖的股,全都起了 <---- 符合标题 |
|
|
|
|
|
|
|
|
|
|
|
发表于 14-4-2009 01:26 PM
|
显示全部楼层
回复 31# peng01 的帖子
peng01, 你还持这什么票? |
|
|
|
|
|
|
|
|
|
|
|
发表于 14-4-2009 01:55 PM
|
显示全部楼层
|
|
|
|
|
|
|
|
|
|
|
楼主 |
发表于 14-4-2009 02:15 PM
|
显示全部楼层
回复 32# asimo 的帖子
|
看顶楼 ,剩 ntpm 大便纸 |
|
|
|
|
|
|
|
|
|
|
|
楼主 |
发表于 15-4-2009 12:28 PM
|
显示全部楼层
今天正式宣布所有股票脱手 10个月来总盈利才 4.5% 
[ 本帖最后由 peng01 于 20-4-2009 12:35 AM 编辑 ] |
|
|
|
|
|
|
|
|
|
|
|
发表于 15-4-2009 12:34 PM
|
显示全部楼层
|
|
|
|
|
|
|
|
|
|
|
楼主 |
发表于 11-5-2009 01:10 PM
|
显示全部楼层
http://nexttrade.blogspot.com/20 ... ket-is-sighted.html
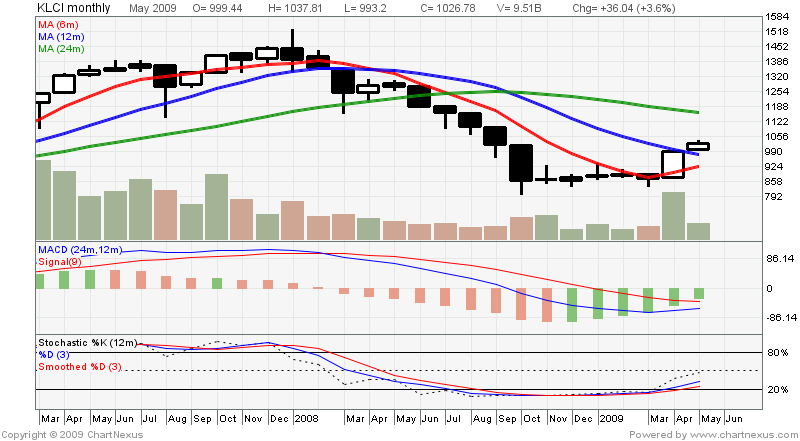
The 2009 Bull Market is sightedThe question that was raised many times over the past few weeks iswhether this current market rally is a bear market rally or is it thestart of a bull market? I can now give a firmer answer- backed bychart- that this rally is very likely to be a bull market in the samemold as 1998-2000 bull market. Since the month of April is now behindus, the monthly MACD indicator has now been fixed & it's a positivecrossover; thus confirming that the market has bottomed in March &the recovery has just begun.

Chart 1: KLCI's monthly chart as at 4/5/2009 (Source: Quickcharts)
Inthe past 2 or 3 weeks, I have been making the case for a moremeaningful correction, but none has occurred. In fact, a commonquestion that cropped up every time remisiers gathered around the watercooler is "When will the correction take place?" This has now beenreplaced by wishes or pleadings for some price retreats as many haveyet to gain any significant position in the market. Even sinistercloud, blown in by the Swine Flu outbreak, failed to break the momentumof the market. As we examine the bull market of 1998-2000 later, wewould see that this earlier bull market did not have any sharpcorrection during its first 4 months of rallying off the low. Since ourpresent rally is only 2 months old, there is a good chance that themarket may climb further before the onset of meaningful correction.
InChart 1 above, I have overlaid the Fibonacci retracement ratio for yourguidance. You would see that the KLCI has up to yesterday retraced 29%of the ground ceded in the preceding bear market (from its high of 1524to its low of 801). When compared to the 35% retracement achieved underthe 1st phase of the 1998-2000 bull market, the upside of the presentrally may be limited.
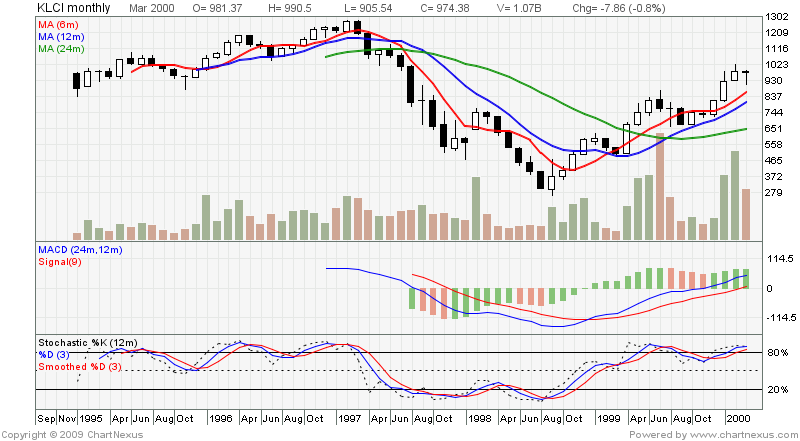
Let's examine the bear market of 1996-98& the ensuing bull market of 1998-2000 (see Chart 2 below). Backthen, the KLCI dropped from its high of 1278 in March 1997 (denoted as'H') to a low of 261 in September 1998 (denoted as 'L'), before therecovery to a high of 1021 in February 2000 (denoted as 'H1'). Thismeans that the 1998-2000 bull market managed to retrace 75% of its lostground. Imagine how high the current developing bull market will go ifit can regain 75% of its lost ground. The answer would be 1343!
I have tabulated the 3 phases of the bull market of 1998-2000 below:

Chart 2: KLCI's daily chart from end 1996 to early 2000 (Source: Quickcharts)
Finally,you would notice that throughout the 1998-2000 bull market, the 20-daySMA had acted as a support for all minor market corrections. Only whenthe KLCI broke below the 20-day SMA, would the correction or priceconsolidation be extended. You may like to try using any pullbacktowards the 20-day SMA as a trigger for buying into the market, untilthis support failed. Presently, the 20-day SMA for the KLCI is about960. Good luck. |
|
|
|
|
|
|
|
|
|
|
|
发表于 11-5-2009 01:14 PM
|
显示全部楼层
|
|
|
|
|
|
|
|
|
|
|
楼主 |
发表于 11-5-2009 01:54 PM
|
显示全部楼层
|
|
|
|
|
|
|
|
|
|
|
楼主 |
发表于 6-8-2009 05:38 PM
|
显示全部楼层

这次 下降了10个月,横摆4个月(到3月09年)
现在上升4个月(4月开始升)
现在总共历时 18个月。
连涨4个月了,8月看涨,9月不清楚。
[ 本帖最后由 peng01 于 6-8-2009 05:43 PM 编辑 ] |
|
|
|
|
|
|
|
|
|
| |
 本周最热论坛帖子 本周最热论坛帖子
|


 1634
1634  61
61